Appearance
MGX
Use Cases
Data analysis/modeling/visualization: integrating David's data processing, analysis, and modeling skills, Alex's development and visualization abilities, and Mike's interpretation and Q&A capabilities for professional data interpretation.
 Reference Links: https://walmart-analysis-zvep1a-v1.mgx.world
> I want to analyze Walmart sales datasets and develop data dashboards where:

**Data analysis and data dashboard:**

> **Executive Summary:**
>> - Analyze overall sales and use a line chart to show sales trends

> **Store Performance Analysis:**
>> - Analyze the performance of each store, including store type distribution chart, top performing stores chart, and detailed store performance statistics

> **External Factors Impact:**
>> - Perform regression analysis on the data to show the impact of external factors

>**Strategic Recommendations:**
>> - Make strategic recommendations based on the analysis results

> **Sales Forecasts:**
>> - Make sales forecasts based on the existing data

> **Risk Analysis:**
>> - Make risk predictions based on the existing data

> **Sources:**
>> - Here is the dataset to be analyzed. `#XXX.csv`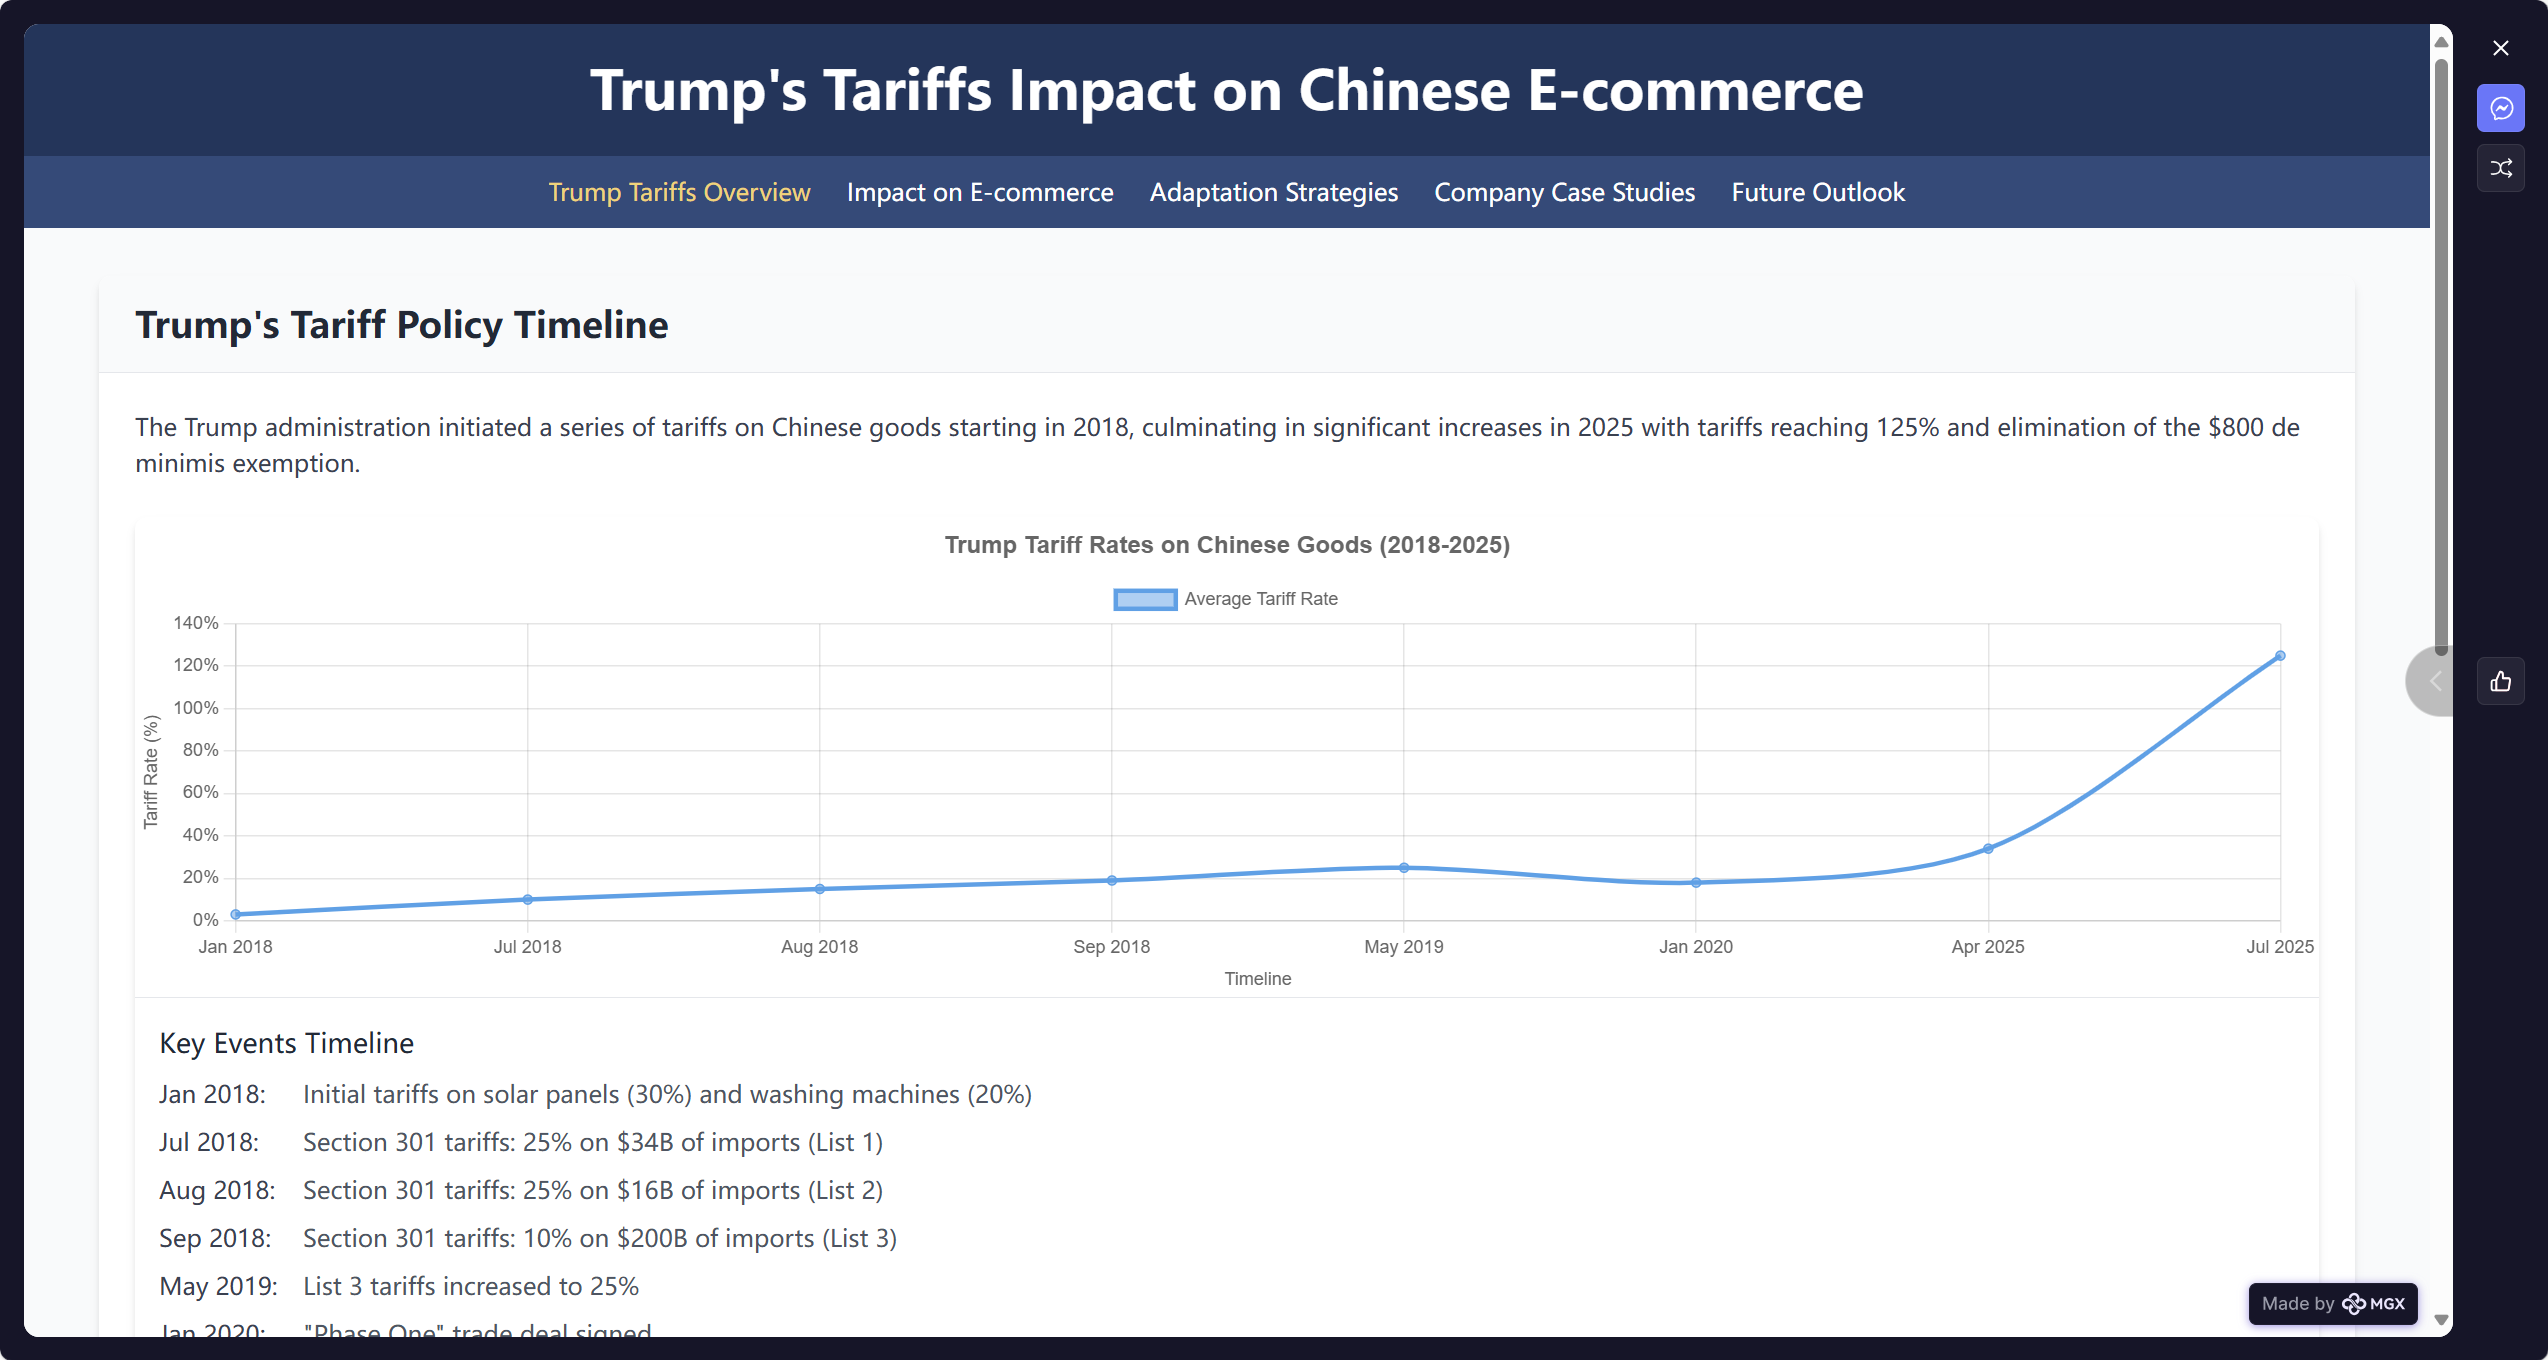 Reference Links: https://mgx.dev/app/e8a42
> - Search trump's tariffs, analyze chinese cross border e-commerce companies' reactions.
> - Create multiply webpages to introduce it.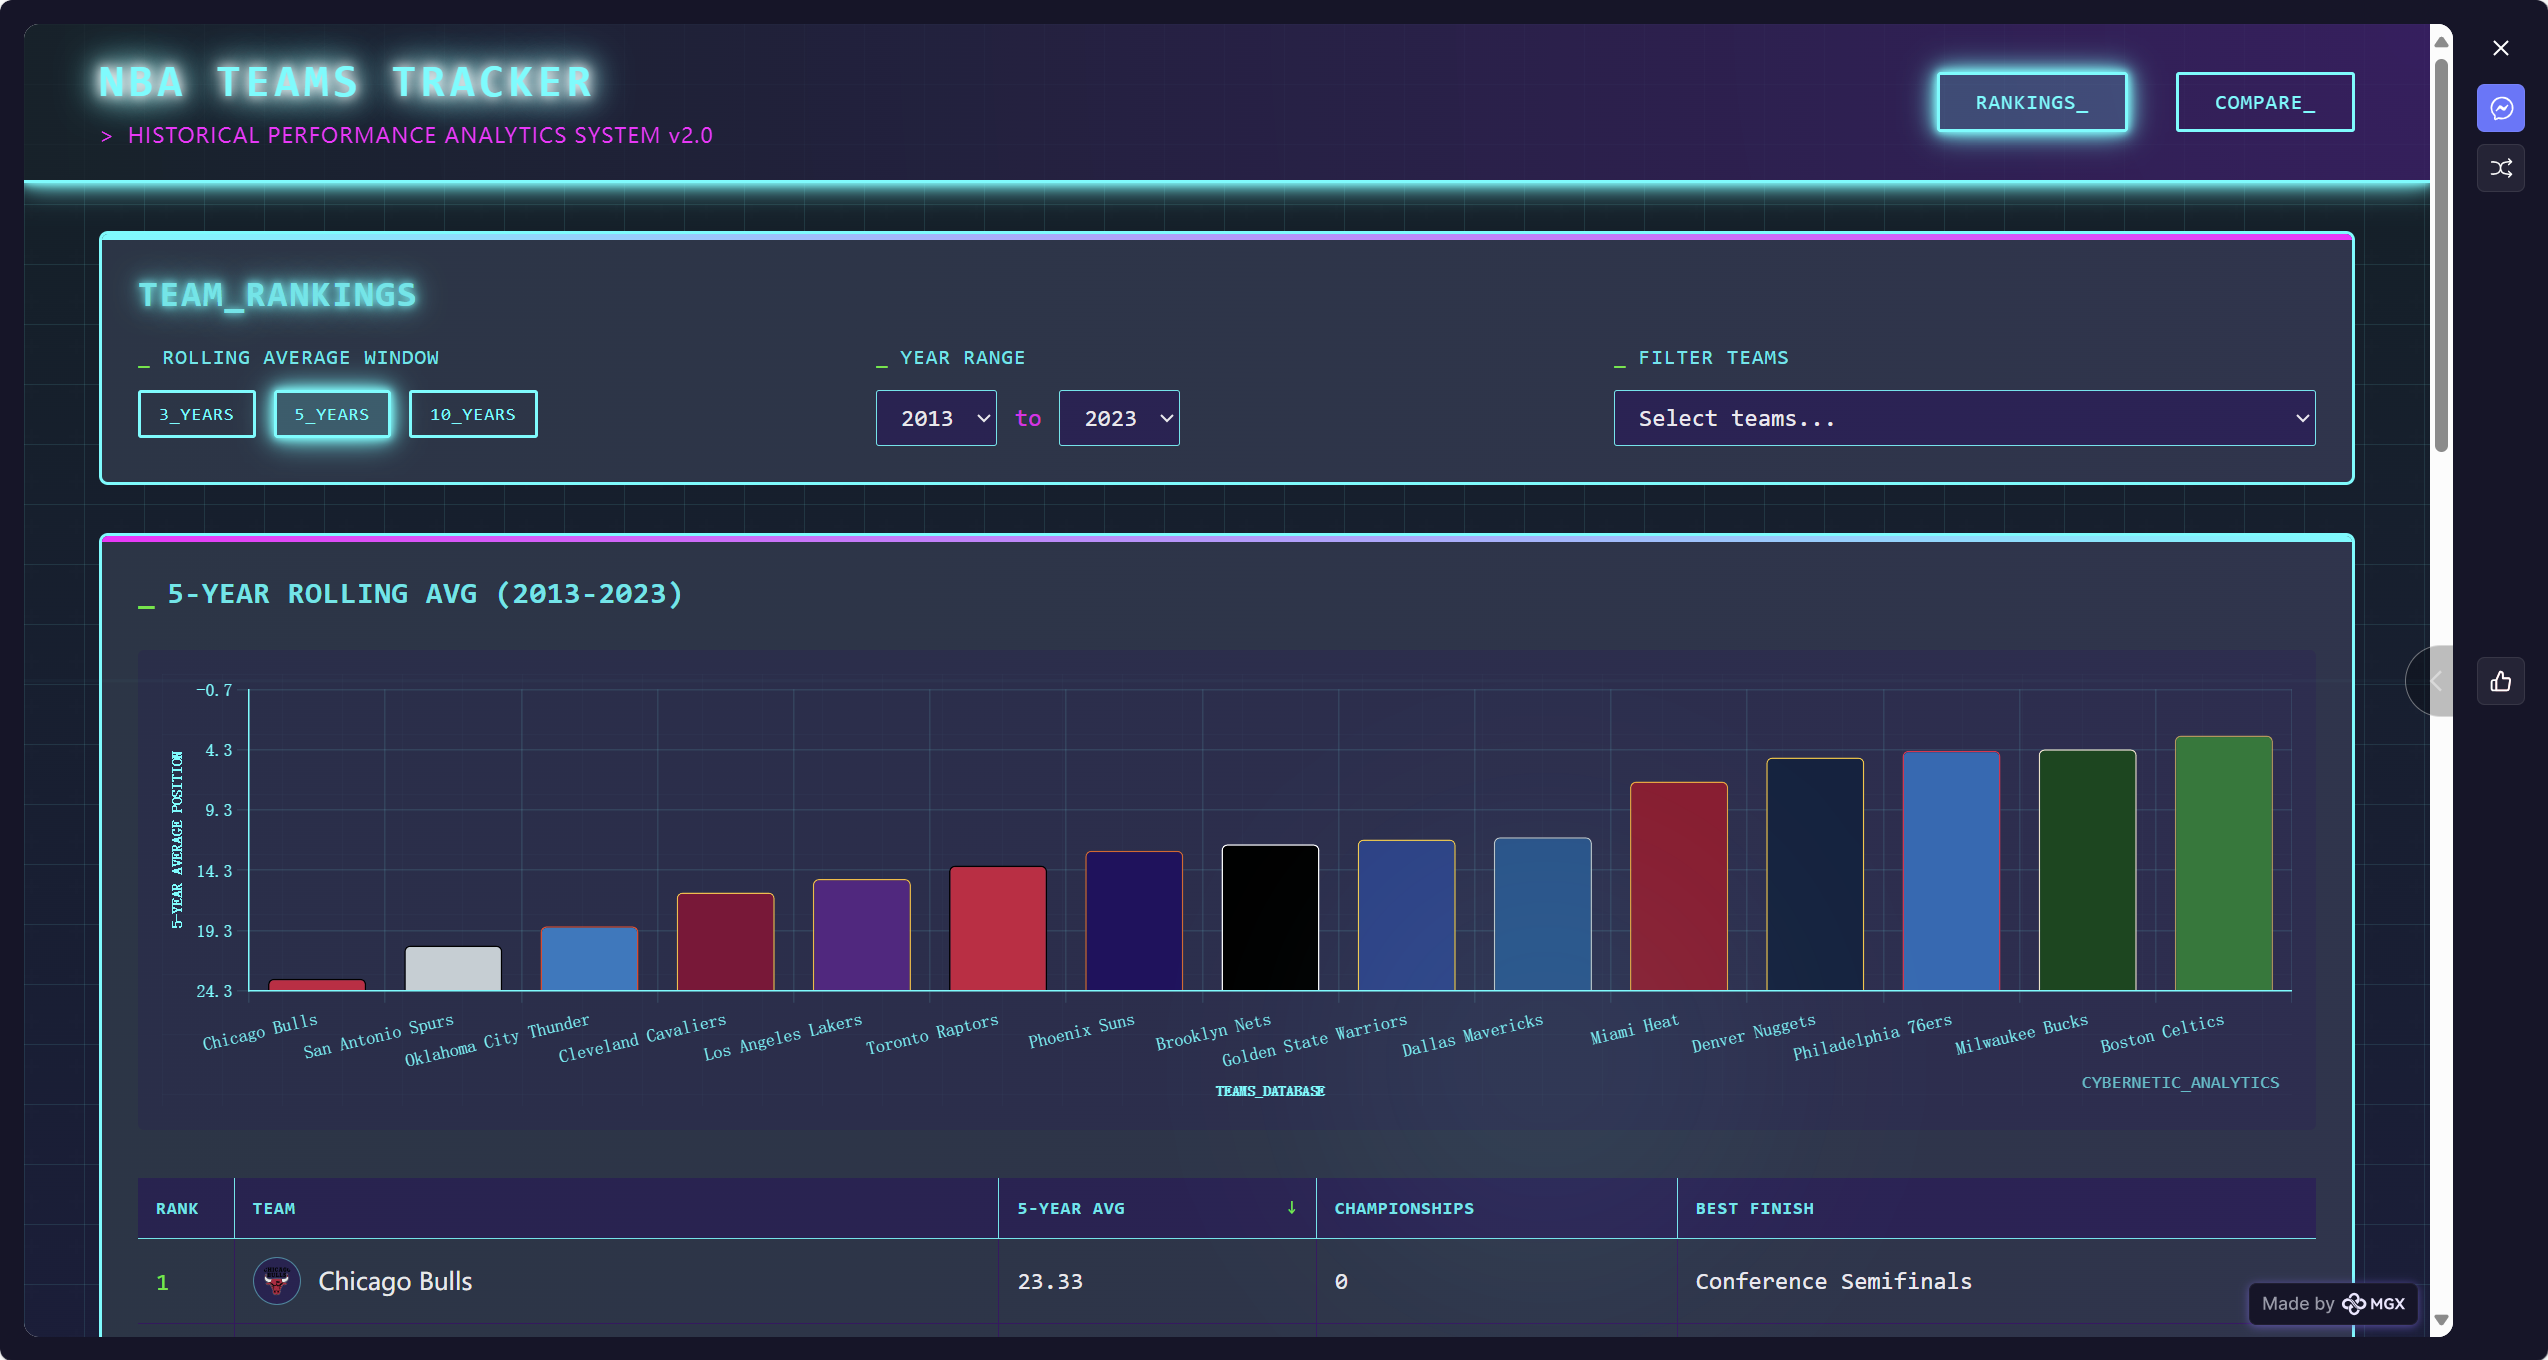 Reference Links: https://mgx.dev/app/4rl6j
**Create a Dynamic NBA Tracking Web Platform**

> - **Season Tracking**
>> - Track NBA teams' final positions for each season.
>> - Cover regular season results and playoff outcomes.

> - **Ranking System**
>> - Assign finishing positions based on postseason performance.
>> - Designate champions, finalists, and conference semifinalists.
>> - Implement a rolling average mechanism.
>> - Allow time window selection (e.g., 3, 5, or 10 years).

> - **Interface & Presentation**
>> - Integrate a responsive interface using a modern JavaScript framework.
>> - Present interactive charts.
>> - Use clear color coding, engaging animations, and detailed tooltips.
>> - Highlight triumphant seasons with celebratory visual cues or team logos.

> - **Comparison View**
>> - Include a view for comparing annual standings under chosen averaging criteria.
>> - Enable users to quickly grasp teams' sustained success.

> - **User Experience**
>> - Implement smooth transitions.
>> - Provide intuitive filtering controls (e.g., year ranges, team selection, and window sizes).
>> - Ensure efficient caching or precomputation for instantaneous updates.

> - **Data Management**
>> - Secure data access credentials on the backend.
>> - Schedule frequent refresh tasks deliver to current, accurate information.